Highlights
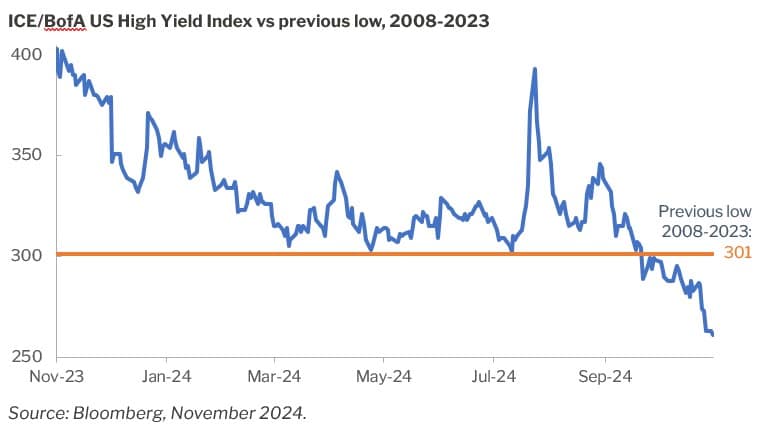
- Credit markets had their second negative month of 2024 in October as government bond yields reversed all the decline of the summer months. Credit spreads continued to grind tighter, with high yield spreads hitting new post 2007 lows in October.
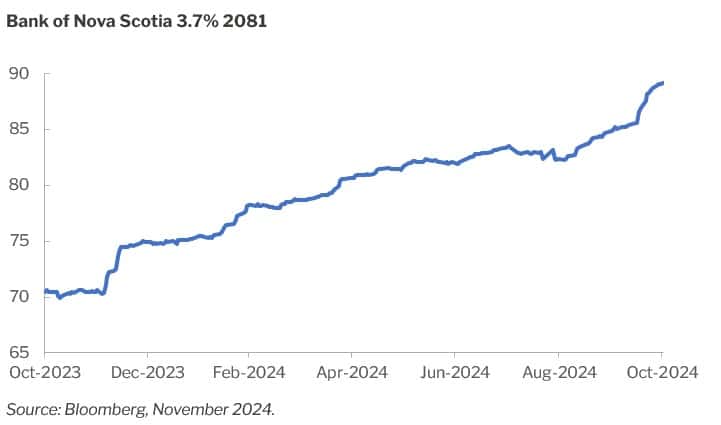
- Selling activity included positions in Canadian bank low reset Limited Recourse Capital Notes (“LRCNs”) issued in Canadian dollars in 2021 which we had accumulated in 2023 at $75 and below. In October, we sold out of the bulk of our holdings at a profit.
- The reduction in credit spreads and risk premiums provided few trading opportunities with the collapse of volatility.
The Pender Alternative Absolute Return Fund finished October with a return of 1.2% bringing year-to-date return to 6.0%[1].
For credit markets, October proved to be the second negative month in 2024 as government bond yields reversed all the decline of the summer months. Credit spreads continued to grind tighter, with high yield spreads hitting new post 2007 lows in October, with further compression in early November following the election of Donald Trump in the United States. The Fund’s benchmark, the HFRI Credit Index returned 0.5% in October.
Portfolio and Market Update
The continued grind lower in credit spreads and risk premiums generally is a difficult environment for us to add value as trading opportunities are diminished with the collapse of volatility. While much of liquid high yield started the year at what we considered to be very expensive levels, there were pockets of value that had lagged the ferocious year-end rally last year. One such pocket we believed was in Canadian bank low reset Limited Recourse Capital Notes (“LRCNs”) issued in Canadian dollars in 2021. We accumulated positions in several of these issues in 2023 at dollar prices of $75 and below (more than 25% below issue price). Our holdings, issued by Toronto Dominion, The Royal Bank of Canada and Bank of Nova Scotia have all performed well this year but got a jolt in October when a USD LRCN issue from RBC generated significant buying interest in all three issues. On the back of this strength, we sold the bulk of our holdings. Ironically, the RBC issue that caused the multi-point rally in our holdings traded quite poorly, finishing October at a price of about $97 after pricing at $100 on October 17th.
We were surprised at the magnitude of the move in risk markets following the US election. Betting markets had shown that Trump was a clear favorite to win. The usual uncertainty and market volatility that occurs in September and October of a presidential election year did not transpire this year, we believe this was due to Trump’s increased probability of winning and the market’s assumption that lower taxes and less regulation would improve earnings and multiples going forward.
While we agree with the market’s assessment of regulation and tax policy under Trump as being supportive to valuations, there are some negative aspects to his policy playbook that the market does not seem to be focused on, namely mass deportations and increased tariffs. Both of Trump’s likely immigration and trade policies are clearly inflationary which was evident in the reaction from bond markets in both the lead up to the election and once the outcome was known. The market appeared to reflexively go back to the 2016 playbook, when the reality is that the set-up is quite different this time.
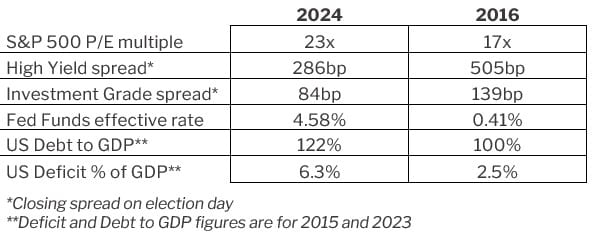
Relative to the conditions when Trump won in 2016, risk premiums are much lower, monetary policy is more restrictive while both the debt and the deficit offer less room for fiscal stimulus. We believe at some point the US Treasury market will show serious concerns about the fiscal position of the US government, but do not have a strong view of when that will occur. The US is already running the largest deficit relative to GDP among developed countries, suggesting limited room to maneuver.
“We believe at some point the US Treasury market will show serious concerns about the fiscal position of the US government…The US is already running the largest deficit relative to GDP among developed countries, suggesting limited room to maneuver.”
As of the time of writing, the bottom for high yield spreads in the immediate euphoria of the election was 261bp, which is 40bp through the 2008-2023 low and just 20bp above the 2007 bottom of 241bp. Much like the move lower in spreads over the past two months, in 2007 the bottom in spreads was accompanied by a significant sell off in US treasuries. The November low in spreads occurred with the 5-year treasury yield of 4.31% while the 2007 bottom coincided with a 5-year yield of 4.97%. So, although spreads are slightly higher than 2007, the all-in yields are worse for the high yield market now than they were then. While in the short-term spreads could continue to tighten, the chances of a material spread widening event in the next six months has increased in our view.
History has shown that euphoric markets and expensive valuations do not last, and often create conditions for material repricing events. While it has been a challenging year to be defensively positioned, we believe we are well structured to capture opportunities when volatility and increased risk aversion inevitably return.
Portfolio metrics:
The Fund finished October with long positions of 135.5% (excluding cash). 57.4% of these positions are in our Current Income strategy, 69.2% in Relative Value and 8.9% in Event Driven positions. The Fund had a 55.1% short exposure that included 4.2% in government bonds, 34.7% in credit and 16.2 in equities. The Option Adjusted Duration was 0.98 years.
Excluding positions that trade at spreads of more than 500bp and positions that trade to call or maturity dates that are 2025 and earlier, Option Adjusted Duration declined to 0.77years. The duration figure include an Event Driven position where we believe duration does not accurately reflect the option value embedded in the security.
The fund’s current yield was 5.73% while yield to maturity was 6.17%.
Justin Jacobsen, CFA
November 15, 2024
[1] All Pender performance data points are for Class F of the Fund. Other classes are available. Fees and performance may differ in those other classes.