Dear Unitholders,
The Pender Alternative Absolute Return Fund returned 0.0%1 in August, bringing year to date returns to 1.0%.
August was an encouraging month for risk assets, the catalyst being Jerome Powell’s speech at Jackson Hole with more than half of the 7% monthly return of the Russell 2000 Index coming on August 22, the day he delivered his 20-minute keynote speech. Credit markets were boosted by the enthusiasm for potential future rate cuts as well as very muted supply in the second half of the month, a traditionally slow period ahead of the Labour Day holiday. Despite the strong risk tone in late August, the ICE BofA US High Yield Index saw spreads close the month at 284bp Govt OAS, just 3bp lower than where they started the month. The HFRI Credit Index which is the Fund’s benchmark returned 1.2% in August, bringing year to date returns to 6.2%.
Portfolio & Market Update
Market euphoria, driven by Powell’s speech, hurt the Fund’s performance in the month as our hedges ran up late in the month. Early in the month, our hedges performed well following very weak employment market data releases in the US and Canada. In the weeks that followed, the market appeared to interpret weak employment data as positive, given that it increases the probability of further interest rate cuts by the Federal Reserve. The “bad news is good” dynamic only holds if data indicate a slowing economy not a recession, so sustainably bad news would likely cause market dynamics to shift.
A robust new issue market in both Canada and the US high yield market presented opportunities for the Fund to deploy capital into new issuers in August. We participated in new issues from Millrose Properties Inc (NYSE: MRP), Boyd Group Services Inc (TSX: BYD) and Peak Achievement Athletics Inc (privately owned by Fairfax Financial Holdings, TSX: FFH). The US high yield market has seen a lot of issuance so far in September. Unfortunately, few of these bonds have come with attractive concessions which has kept us mostly on the sidelines.
We have been actively looking for shorter duration cash alternatives with limited downside to increase the Fund’s carry while we wait for a more attractive market environment. We are expecting an active fall for calls of several shorter duration positions, but as of the time of writing we haven’t had any material calls yet.
Despite the market performing well, we are seeing some increasing evidence of stress on the margins as many weaker credits have come under pressure, the distress ratio in the high yield market increased in August for the first time since April. Broadly syndicated loans had the highest proportion of “blow-ups” or drops of 10 points or more in over a year in August, according to Bank of America data2.
We established a small short position in the bonds of an overleveraged US public REIT with exposures to hotels and service focused retail. The REIT is actively selling a significant portion of its asset base to pay down debt but announced in early August that the proceeds from asset sales would be less than their guidance to the market earlier this year. The company was not in compliance with their interest coverage covenant following Q2 results and elected to draw down their entire revolving credit facility prior to the end of the quarter. This is an extremely aggressive tactic reminiscent of how several companies preserved liquidity in March 2020. We believe this scorched earth approach to dealing with banks is unlikely to serve the company well in the future. In September, the REIT was downgraded to Caa1 by Moody’s. We see significant downside to the company’s bonds and the potential for forced selling in the coming weeks.
Market Outlook
In contrast to the buoyant risk appetite in markets over the summer, there has been mounting evidence of weakening economic fundamentals in the labour market in both Canada and the United States. Inflation does not appear to be moderating further and could see a delayed increase from tariffs in the coming months following the end of the de minimis exception in late August. There is a real risk of stagflation.
Spreads are tight and equity multiples are high. Cameron Crise, who writes the Macro Man column at Bloomberg, tracks what he calls the “Hopes and Dreams ratio” which is the amount of a stock or market’s valuation that is not explained by book value and the NPV of the next three years of earnings. In August, the Hopes and Dreams ratio for the S&P 500 hit 67.8%, its highest level since April 2000, which was one month following the peak of the dot com bubble. Importantly, the ratio had first hit those levels in April 1999, so its valuation alone doesn’t indicate that a sell off is imminent. While a new 25-year high was reached in August, the ratio was very close to this level as far back as November 2024 following Trump’s election.
While valuations tell us little about where the market might go over the short term, over the long run valuation can be a dependable predictor of forward returns.
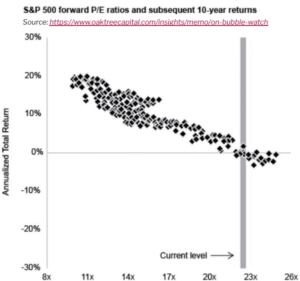
The S&P 500 forward P/E ratio has hung around 23x in recent weeks and for much of the past ten months, as noted in this chart.
As expensive as markets are at the macro level, we are becoming more optimistic about valuations of some of our holdings which haven’t participated in the broad market rally. Groupthink is real in credit markets and some issues with limited sponsorship have been driven down by some aggressive selling in recent weeks despite limited or no fundamental news. We believe several long positions in the Fund are well positioned to outperform broad markets in the coming months.
Portfolio Metrics
The Fund finished August with long positions of 117.2% (excluding cash and T-bills). 33.1% of these positions are in our Current Income strategy, 81.7% in Relative Value and 2.4% in Event Driven positions. The Fund had a -59.0% short exposure that included -3.2% in government bonds, -36.4% in credit and -19.4% in equities. The Option Adjusted Duration was 1.72 years.
Excluding positions that trade at spreads of more than 500bp and positions that trade to call or maturity dates that are 2027 and earlier; Option Adjusted Duration declined to 1.23 years.
The Fund’s current yield was 5.73% while yield to maturity was 6.88%.
Justin Jacobsen, CFA
September 17, 2025
[1] All Pender performance data points are for Class F of the Fund unless otherwise stated. Other classes are available. Fees and performance may differ in those other classes. Standard Performance Information for the Fund may be found at www.penderfund.com.
[2] Bank of America Global Research and ICE Data Indices LLC