Highlights
- We continue to focus on the fundamentals, rotating into high quality businesses.
- We initiated new positions in two companies during the quarter that we have been following for a long time but have finally hit our buy zone.
- Small caps are trading near trough valuations. The re-rating in multiples, we believe, is a tailwind as risk appetite returns and new leadership emerges.
The Pender Small Cap Opportunities Fund was down 2.1% in the quarter and remains relatively flat so far in 2023, delivering a return of -0.3 YTD[1]. Not a total coincidence but risk-off has been pulsing through the markets for weeks now and has clouded the outlook for the next few quarters. Rapidly rising bond yields throughout the quarter and the concern that this will hamper growth has contributed to the uncertainty and investors have turned more cautious on small cap equities as a result.
Head Fake in Small Caps
The second quarter was a head fake in small caps. As with other periods when top heavy indexes have driven returns, the last five years have provided another challenging environment for active management. The real question is: When will the trend reverse and finally become our friend? That friend has currently ghosted active managers.
Our small cap universe has seen massive share price corrections as investors have stampeded out of non-index and small cap names in favour of the relatively easy returns of index funds. And who can blame them? With 155% cumulative returns in the S&P 500 over the past decade compared to 89% in the S&P 600 or 66% in the Russell 2000 Index[2], outperformance in small caps has been hard to come by.
“The historical relationship between large caps and small caps has moved to an extreme that dramatically favours the setup for small cap for the next market cycle.”
Are Times A-Changing?
Over the last six months we have experienced a market that reminds us of the early 2000s and the dot com market correction era. It is hard to find anyone who still wants to sell a small cap stock. It looks like everyone who wanted to sell already has.
This creates an interesting point in time in the market cycle. With news flow in these in already discounted and sold off small cap stocks, we are seeing companies with weak results not moving their stock prices much at all. Conversely the companies with positive results are trading up. Optimism appeared to have kicked in during July and early August. That was the head fake! We are back to the pre-summer trading levels of many of our key holdings.
While we don’t know when, we do believe the friend who ghosted us is getting ready to reach out and start another wonderful 5-10-year relationship. The historical relationship between large caps and small caps has moved to an extreme that dramatically favours the setup for small cap for the next market cycle. This trend will be a friend to small cap stocks again. The last time this happened was in the early 2000s following similar price appreciation and narrow concentration in a select few large cap technology companies. The table below outlines the results we saw, with small caps going on an extended run compared to large caps, outperforming by an average of ~12% per year.
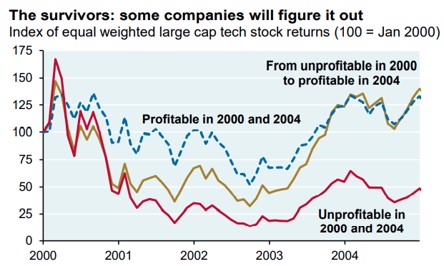
With small caps trading near trough valuations today, these companies are already priced for an uncertain environment ahead. The re-rating in valuation multiples we believe is a tailwind as risk appetite returns and new leadership emerges from strong companies. This is similar to early 2000-2005 period when companies that proved they can deliver profitable growth emerged as the long-term winners in small cap technology. The following chart shows just that—with the yellow line showing companies that became profitable rebounding through 2003 and 2004 following an indiscriminate sell-off in the early part of that decade.
| 2000 | 2001 | 2002 | 2003 | 2004 | 2005 | |
| S&P 500 | -9.1% | -11.9% | -22.1% | 28.7% | 10.9% | 4.9% |
| S&P 600 | 11.8% | 6.5% | -14.6% | 38.8% | 22.6% | 7.7% |
| Small Cap Outperformance | 20.9% | 18.4% | 7.5% | 10.1% | 11.7% | 2.8% |
Source: YCharts
The M&A cycle is another element to highlight with several deals announced recently. An example is H20 Innovations Inc. (TSX:HEO), that was taken private at a 68% premium to their previous closing share price. The largest shareholder rolled over their existing stake in the company while committing additional capital, bringing private equity and insider ownership to 45% and a 26% premium to their 52-week high. This company was not held in the portfolio but highlights the perceived value of the company to sophisticated and knowledgeable buyers that was not recognized in the current market. This is more of a take-under than a takeover and demonstrates the extreme valuation disconnect in today’s environment.
We continue to focus on the fundamentals, rotating into high quality businesses. We have made some small adjustments in the portfolio, adding where we have high conviction. We initiated new positions in two companies during the quarter that we had been following for a long time and that finally hit our buy zone (more on these in future commentaries). When we can buy businesses we want to own for the next ten years at distressed valuations, I am very optimistic when I think about where we may be in 5-10 years with our new BFF.
David Barr, CFA and Sharon Wang
October 12, 2023
[1] All Pender performance data points are for Class F of the Fund unless otherwise stated. Other classes are available. Fees and performance may differ in those other classes. Standard Performance Information for the Fund may be found here: https://penderfund.com/solutions/
[2] Source: Capital IQ, as at 30 September 2023.