Highlights
With improved valuations, the Fund added to long credit positions, while also topping up short positions in equity index ETFs. We believe that the divergence between credit and equities, which has been widening since March, will eventually mean revert, as credit conditions are typically a leading indicator of economic activity and asset prices.
The Fund has maintained equity index hedges for the past 18 months, but we have tilted the Fund towards large-cap indices recently in response to valuations.
We believe that some of the most mispriced securities in the market are preferred shares and the Fund established positions in several individual issues, such as Enbridge preferred series Y.
In the Fund’s Event Driven strategy, we have actively traded Black Knight Inc.’s (NYSE: BKI) proposed acquisition by Intercontinental Exchange Inc. (NYSE: ICE) since late 2022.
--
Dear Unitholders,
The Pender Alternative Absolute Return Fund finished May with a return of 0.1%, bringing year-to-date returns to 3.3%[1].
May was an eventful month for markets. Incoming economic data implied that interest rates are likely to stay higher for longer, which weighed on fixed income markets. Large-cap equities were unfazed by higher discount rates and plowed higher driven by enthusiasm about the potential of artificial intelligence (AI). An increasingly narrow set of market leaders is not healthy for the market, but investor psychology and FOMO might continue to drive performance over the short term. The ICE BofA US High Yield Index put up its worst absolute return since February, returning -0.9%. Option Adjusted Spread (OAS) widened 16bp to finish the month at 469bp. In contrast to large-cap equities, the high-water mark for the high yield market in 2023 was on February 2. Since that time the price return was -3.9%, including carry the market has returned -1.8% with spreads 75bp wider. It seems unlikely to us that spreads will revisit early February levels in the near term.
Market update
With improved valuations, the Fund added to long credit positions in May, while also topping up short positions in equity index ETFs. We believe that the divergence between credit and equities, which has been widening since March, will eventually mean revert, as credit conditions are typically a leading indicator of economic activity and asset prices. Current market dynamics echo divergences that we have seen in past market cycles. In 2007, credit markets peaked approximately four months before large-cap equities and bottomed out in December 2008, roughly three months before equities. While enthusiasm for AI is justifiable, a well-understood theme with strong retail investor participation has some similarities to the “dot-com” bubble of 1999-2000. We believe that the underlying reasoning behind the theme will be correct just as it was in 2000. While the internet did indeed change the world, valuations were not supported by the cash flows that followed.
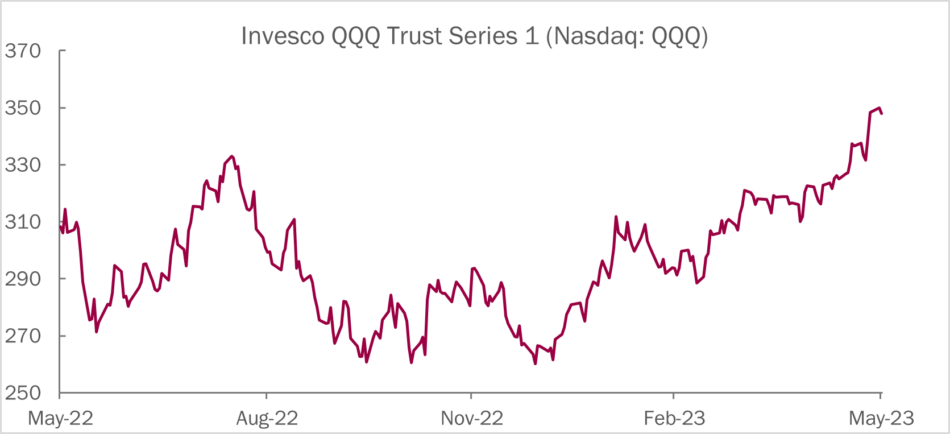
We find it hard to square the valuation of mega-cap technology stocks with what we believe is an appropriate discount rate. Looking at month-end prices relative to Bloomberg consensus 2023 calendar year-adjusted EPS estimates, the seven largest components of the Invesco QQQ Trust Series 1 (Nasdaq: QQQ) trade at an average P/E multiple of 36.9x, with expected EPS growth of 25% in 2024, decelerating significantly thereafter.
 Source: Bloomberg, as at May 31, 2023.
Sell-side analysts are generally an optimistic group, so it would be rational for markets to discount a slightly less favourable outcome. After all, Apple, Alphabet, Nvidia, Meta and Amazon all generated negative earnings per share (EPS) growth in 2022. With Tesla expected to report negative earnings growth in 2023, that leaves only Microsoft among the big seven that won’t have a negative earnings growth print in either 2022 or 2023, and that company put up a paltry 3% EPS growth figure in calendar 2022. While these are mostly great businesses, based on the multiples they trade at, the perception of consistent earnings growth might exceed reality. Ultimately, their customers are individual consumers and businesses that are sensitive to economic cycles, which could cause them to pull back on advertising and discretionary spending, such as luxury vehicle purchases. The Fund has maintained equity index hedges for the past 18 months, but we have tilted the Fund towards large-cap indices recently in response to valuations.
 Source: Bloomberg, as at May 31, 2023.
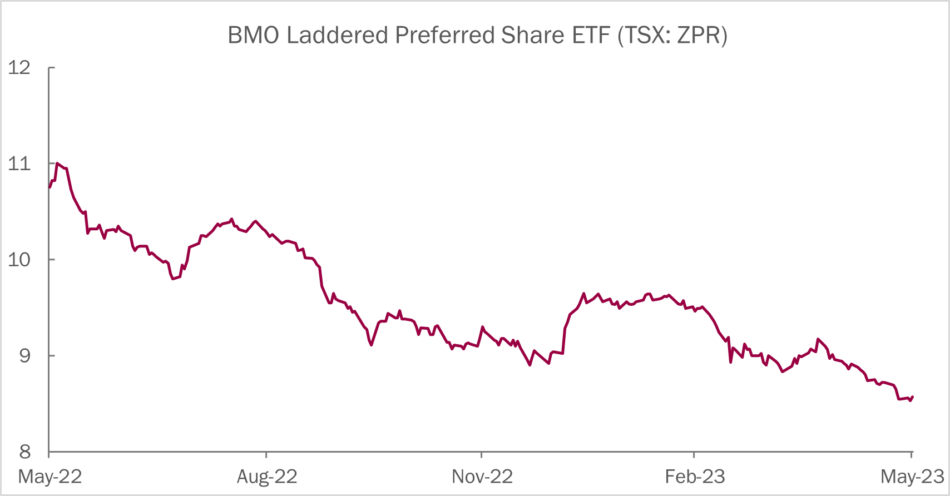
While high-multiple equities should be negatively impacted by higher rates, they haven’t been impacted in recent months. In contrast, Canadian rate reset preferred shares should benefit from higher rates, as their coupons reset every five years at a fixed spread over five-year government bond yields. This has not been the case as the market has performed poorly, partially driven by exposures to out of favour sectors like banking and energy infrastructure. We now believe that some of the most mispriced securities in the market are preferred shares and the Fund established positions in several individual issues late in May. Our largest preferred share holding is in Enbridge Inc. preferred series Y (TSX: ENB.pr.Y), which we purchased at a price of $14 and below (56% of $25 par value). The coupon for this security will reset in September 2024, and if the Canada five-year yield is the same rate then as it was at the end of May, the current yield for this security would be over 10% at our purchase price.
 Source: Bloomberg, as at May 31, 2023.
“We find it hard to square the valuation of mega-cap technology stocks with what we believe is an appropriate discount rate.”
We believe that the potential path of interest rates is balanced from here, while the performance of securities like QQQ and ZPR (TSX: ZPR) would argue that the market is expecting lower rates over the near term. Market pricing could be reflective of recency bias following almost 15 years of exceptionally easy monetary policy. If the past year has taught us anything, it is that the economy can handle much higher rates than previously thought, which supports the argument that neutral policy rate estimates should be revised higher by central banks.
In the Fund’s Event Driven strategy, we have actively traded Black Knight Inc.’s (NYSE: BKI) proposed acquisition by Intercontinental Exchange Inc. (NYSE: ICE) since late 2022. Much like the Rogers-Shaw merger, there is significant antitrust scrutiny of this transaction, which has caused BKI’s equity to trade at a large discount to the agreed transaction price, implying a relatively low probability of the deal being completed. What makes this transaction attractive to us is that ICE issued a 40-year bond in May 2022 that has a Special Mandatory Redemption (SMR) feature that requires the bond to be taken out at a price of $101 if the deal were to break. The package of BKI equity and ICE 5.2% 2062 bonds at times have priced in dramatically different deal completion probabilities. The market pricing of the SMR option has become much more efficient in recent months than it was in fall 2022, while the long duration of the security has created several opportunities to buy at an attractive discount to $101 and sell close to the SMR price a few weeks later. We have sold out of the ICE 5.2% 2062 bond three times and are currently long for a fourth time.
While there is little evidence of risk aversion in certain pockets of capital markets, weakness in commercial real estate and banking could be leading indicators that may adversely affect the broader economy in the quarters ahead.
Portfolio metrics
The Fund finished May with long positions of 123.2%. 21.0% of these positions are in our Current Income strategy, 97.3% in Relative Value and 4.9% in Event Driven positions. The Fund had a -67.6% short exposure that included -16.1% in government bonds, -35.5 in credit and -16.1 in equities. The Option Adjusted Duration was 2.21 years.
Excluding positions that trade at spreads of more than 500bp and positions that trade to call or maturity dates that are 2025 and earlier, Option Adjusted Duration declined to 0.98 years. The duration figure includes an Event Driven position where we believe duration does not accurately reflect the option value embedded in the security.
The Fund’s current yield was 4.99% while yield to maturity was 7.61%.
Justin Jacobsen, CFA
June 6, 2023
[1] This Pender performance data point is for Class F of the Fund. Other classes are available. Fees and performance may differ in those other classes.