Alternative Absolute Return – October 2023
Highlights
- Both widening credit spreads and higher government yields negatively impacted returns for the month.
- The Fund increased market exposure with the focus on high-quality, high yield bonds trading at attractive discounts to par.
- The Fund finished the month with our highest exposure to the market all year – about 80% net long excluding positions in short term government securities (in early November, we sold into strength taking our net long exposure to about 50%.).
The Pender Alternative Absolute Return Fund finished October with a return of 0.5% bringing year to date returns to 6.8%[1].
Financial markets had another weak month in October, primarily driven by higher treasury yields. The ICE BofA US High Yield Index generated a return of -1.2% with Option Adjusted Spread (OAS) widening by 39bp to finish the month at 442bp. Both widening credit spreads and higher government yields negatively impacted returns for the month, with the high yield market spending much of the second half of the month around 9.5% yield to worst, close to last year’s peak of 9.6%.
Portfolio and Market Update
The Fund increased market exposure in response to attractive all-in yields in October. Our focus was on high quality high yield bonds trading at attractive discounts to par. While spreads are only average relative to the past decade, all-in yields were too high to ignore. For most of the post-Global Financial Crisis era, government bond yields have offered real yields that were hovering around zero and were often negative. With nominal yields of around 5% across the US Treasury curve in October, real yields have risen above 2% based on a reasonable expectation of forward inflation. While spreads are average, the absolute returns available are attractive due to the embedded real yield in government bond curves. Additionally, low dollar prices also provide optionality and mitigate downside risks.
Yield to worst for the high yield market peaked on October 20, 7bp lower than the October 2022 peak of just over 9.6%. Over the past year, the index duration has moved lower from about 4.2 years to 3.7 years as relatively few issuers have come to market to refinance upcoming maturities. We believe had prices declined further, somewhere between a 2% and 5% decline, significant amounts of opportunistic capital would have looked to enter the market. A 5% decline would have resulted in a market yield of almost 11% and there have been only two days since 2009 when the market has closed with a yield above 11%: March 23 and 24 2020. Economic and corporate fundamentals look much more sound now than they did then.
The Fund finished October with our highest exposure to the market all year at about 80% net long, excluding positions in short-term government securities. With a frenetic rally to start November, particularly following the release of US Non-Farm Payrolls on November 3, we sold into strength taking our net long exposure to about 50%. In some cases, high-quality high yield bonds had seen yields fall by over 100bp from recent peaks, resulting in some issues trading at their tightest spread all year. While markets could continue to rally, especially considering that December and January often exhibit positive seasonality, the structural factors that led to market weakness over the past three months are still present. We have already seen in early November that there is a significant backlog of corporate issuers waiting for market strength to raise capital and extend their maturity profile, this new issue supply could provide a sanity check on how far the market can run going forward.
“In our opinion, the equity market still exhibits a mean reverting impulse to the 2009-2021 ‘easy money’ era which no longer exists and is unlikely to return anytime soon.”
We still believe that large capitalization equities have not adjusted to the reality of a higher cost of capital. Small cap equities are probably a better proxy for the high yield market, both of which saw the most attractive prices in the past year in October and appear to be broadly in sync. The companies in the S&P 500 are largely funding themselves in the investment grade market. While the high yield market yields of about 9.5% experienced in October have been relatively rare in the post-Global Financial Crisis era, similar yields occurred in 2011, 2016, 2020 and 2022. By contrast the last time the investment grade market experienced yields around 6.5% (as happened in October) was in the spring of 2009 when the US economy was in the process of exiting the worst economic downturn in generations. This real cost of capital should have a significant and negative impact on large cap multiples, but the market appears to be anchored to the prior interest rate regime.
ICE BofA US Corporate Index – Yield to Worst (%)
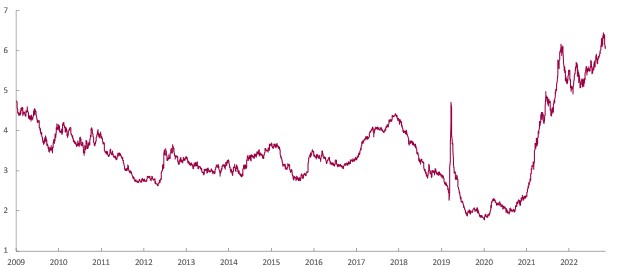
Source: Bloomberg
When you can buy a very high quality eight-year corporate bond at 7% with a significant amount of that return coming in the form of capital gains, it is difficult to justify paying an earnings yield of 5-6% for the S&P 500 index. There should be an additional equity risk premium over corporate bonds to compensate for the fact that equities are not contractual obligations. From what we can tell, the equity market still exhibits a mean reverting impulse to the 2009-2021 ‘easy money’ era which no longer exists and is unlikely to return anytime soon.
Portfolio Metrics
The Fund finished October with long positions of 150.1%. 26.4% of these positions are in our Current Income strategy, 120.3% in Relative Value and 3.4% in Event Driven positions. The Fund had a -55.1% short exposure that included -12.2% in government bonds, -28.5% in credit and -14.4% in equities. The Option Adjusted Duration was 3.14 years.
Excluding positions that trade at spreads of more than 500bp and positions that trade to call or maturity dates that are 2025 and earlier, Option Adjusted Duration declined to 2.72 years. The duration figure includes an Event Driven position where we believe duration does not accurately reflect the option value embedded in the security.
The Fund’s current yield was 6.49% while yield to maturity was 8.67%.
Justin Jacobsen, CFA
November 10, 2023
[1] All Pender performance data points are for Class F of the Fund. Other classes are available. Fees and performance may differ in those other classes. Standard Performance Information for Pender’s Alternative Absolute Return Fund may be found here: https://www.penderfund.com/pender-alternative-absolute-return-fund/


