Highlights
- The primary driver of returns in September were higher interest rates, as 2024 rate cuts are being priced out in favour of a “higher for longer” for reality.
- The Fund continued to sell into market strength early in September before increasing exposure as markets sold off towards the end of the month.
- The Fund recently exited two long positions that we believe are not well set up for a significant re-rating of risk premiums.
The Pender Alternative Absolute Return Fund finished September with a return of 1.0%, bringing year-to-date returns to 6.3%[1].
The high yield market had its worst month since February, and if it wasn’t for a strong close to the month, it would have had its worst month of 2023. The market generated a return of -1.2% with Option Adjusted Spread (OAS) widening by 18bp to finish the month at 403bp. The primary driver of returns in the month was higher interest rates as 2024 rate cuts are being priced out in favour of a “higher for longer” for reality. While spreads are not historically cheap, the yield to worst for the high yield market hit the highest level of the year in early October, above 9%.
Portfolio Update
Our belief that the late summer rally would prove transitory was validated in September. The Fund continued to sell into market strength early in the month before increasing exposure as markets sold off towards the end of the month. We maintained all of our ETF short positions but did selectively cover high-quality high yield shorts where we believed there should be limited downside if the market continues to weaken.
The Fund recently exited two long positions that we felt were not well set up for a significant re-rating of risk premiums. In our view, it is a good time to high grade our exposures to securities with strong business models that are easy to understand at attractive valuations.
The value of liquidity has increased, so the Fund added two short duration exposures in late September and early October earning 10-12% IRRs for terms between two weeks and five months to a tender or call that has been well telegraphed by the issuers. It is our hope that we will be able to identify more of these opportunities if markets continue to be volatile as market participants often look to sell the securities that have the least potential for capital gains in order to meet their liquidity needs.
As we had been expecting, new issue supply picked up in September as corporate issues moved to get in front of 2025 maturities. The West Edmonton Mall issued a first lien mortgage bond in September, and though we did not participate in the issuance, we thought it was interesting that the market clearing coupon was about 7.8% for a four-year term backed by the largest mall in Canada. It is difficult to argue that 6.2% is the appropriate generic cap rate for regional malls in Canada, as recently reported by CBRE. We believe that cap rates should have a premium of at least 1-2% above mortgage financing rates to justify the equity risk premium for owning commercial real estate. The effect of higher rates on illiquid asset values may take several years to be fully realized. We maintain two small equity short positions in poorly positioned office REITs in addition to a bond issued by a lower quality hotel REIT. The short positions act as a hedge to our exposure in this sector, which is largely in high quality hotels where we believe that we have strong asset coverage even in distressed sale scenarios.
Portfolio Metrics
The Fund finished September with long positions of 142.7%. 39.3% of these positions are in our Current Income strategy, 102.3% in Relative Value and 1.1% in Event Driven positions. The Fund had a -56.3% short exposure that included -11.3% in government bonds, -29.9% in credit and -15.1% in equities. The Option Adjusted Duration was 2.04 years.
Excluding positions that trade at spreads of more than 500bp and positions that trade to call or maturity dates that are 2025 and earlier, Option Adjusted Duration declined to 1.76 years. The duration figure includes an Event Driven position where we believe duration does not accurately reflect the option value embedded in the security.
The Fund’s current yield was 5.11% while yield to maturity was 7.32%.
“We believe that extending duration looks attractive on a tactical basis at least, as long-term interest rates have seen a big move in just over two months, tightening financial conditions significantly.”
Market Outlook
The spike in government bond yields since the US Treasury issued its Quarterly Refunding Announcement on July 31 has been the primary driver of most financial asset prices over the past two months. When there is strong momentum for assets in either direction, there can be calls made by market participants who might overly emphasize recent developments. We watched Jamie Dimon’s annual keynote address at the JP Morgan Leveraged Finance conference in early 2021, where he argued that interest rates would rise in the years ahead and this was a much larger risk than spreads as corporate fundamentals were solid. While that was certainly a great call, and far from consensus at the time, we believe that his recent prediction that we will see 7% interest rates is significantly less likely. Our basis for this thinking is that ultimately something will break well before rates reach those levels. We believe that extending duration looks attractive on a tactical basis at least, as long-term interest rates have seen a big move in just over two months, tightening financial conditions significantly.
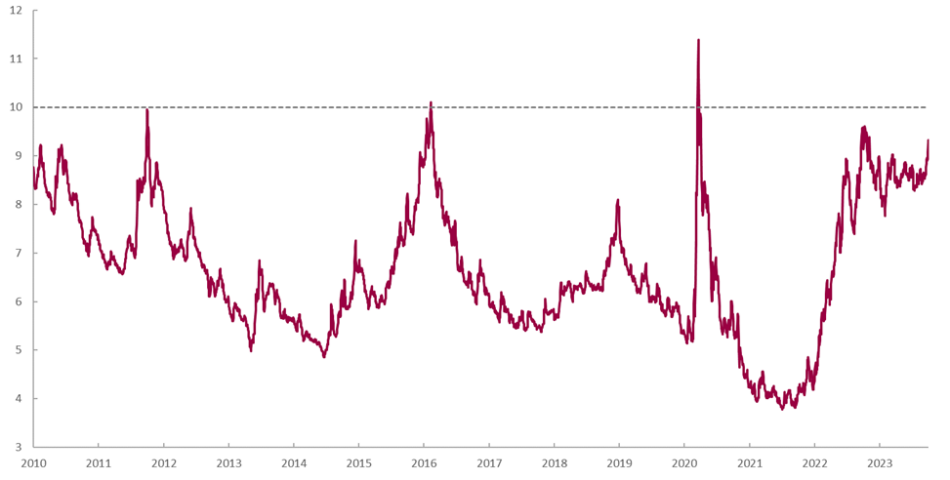
High yield spreads had only approached their long-term average as of the first week of October in the mid-400s on an Option Adjusted Spread (OAS) basis vs. government bonds. However, the all-in yield of about 9.3% is quickly approaching last year’s peak of 9.6% and peaks of the 2011 and 2016 market sell offs when yields peaked at around 10%. While we have historically focused mostly on spreads, we believe that all-in yields are now too high to ignore from a positioning perspective. Even if the market sells off further from here with a duration of just 3.7 years, we believe that the high yield market has a good chance of delivering equity-like returns in the years ahead. This is especially true given that large cap equity multiples remain elevated, arguing that fixed income appears to be relatively attractive on a cross-asset basis.
ICE BofA US High Yield Index – Yield to Worst (%)
Another key development in leveraged finance markets over the past several years is the increasing role of private credit, which has grown from less than $300 billion in 2010 to nearly $1.5 trillion in 2023. In contrast, the high yield market has a market value of $1.2 trillion, which is about the same as it was 10 years ago. While some good quality issuers make up a portion of the private credit market, we believe that many of the smaller, more economically sensitive issuers who might have traditionally come to the high yield market chose instead to access private debt markets. This is particularly true for private equity issuers, as LBOs have increasingly turned to private credit instead of broadly syndicated loans, peaking as high as a 98% share for private credit in Q4 2022. While high historical returns have attracted a lot of capital to private credit, we believe that the market has yet to face a true cycle as the extraordinary intervention from central banks and governments short-circuited the default cycle in 2020. It will be interesting to see how the market fares in the years ahead, but we suspect that not every firm was as careful as they should have been when underwriting transactions during the boom times.
Private Credit – Assets Under Management ($bn)

We believe that the combination of significantly higher base rates and an issuer base that is more skewed toward publicly listed entities argues that a spread blowout might be significantly less severe than in past credit cycles. We had previously thought that spreads might peak at 700-900bp, but in light of base rates moving higher, we think that 600-800bp might be closer to the mark in a recessionary environment. In each of the past three recessions, high yield spreads have hit at least 1000bp.
Justin Jacobsen, CFA
October 11, 2023
[1] All Pender performance data points are for Class F of the Fund unless otherwise stated. Other classes are available. Fees and performance may differ in those other classes. Standard Performance Information for the Fund may be found here: https://penderfund.com/solutions/.